If you've attempted any development on xTuple using scripting then you've probably found the debugging routine a bit tedious, to say the least. It has been mostly a manual process of reviewing the command line console for uncaught exceptions, and inserting try/catch blocks and print statements in your code to track down otherwise silent bugs. If you're running on Windows, it's all the worse because print statements don't print anywhere useful, leaving would-be Windows script developers almost completely in the dark.
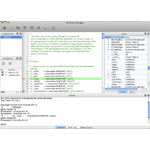
Version 3.4.0 of xTuple (currently in beta release) exposes Qt's powerful script debugging engine that suddenly brings all those nasty little bugs into the light. It provides a graphical IDE style interface that highlights uncaught exceptions and allows you to step through code execution.

To enable the script debugger simply go to the new “Advanced” tab in user preferences and check “Enable Script Debugging.” That's it. Now when you launch a window that has any scripting in it, the debugger will automatically launch when it encounters an uncaught exception with the errant line of code highlighted in red.
There is however, much, much more.
You can force the debugger to stop the code and launch simply by putting the word “debugger” anywhere in your script code. Once the debugger is open, you are provided with a command console that allows you to insert break points at run time like this:
.break 59
After that you can click the “Continue” button to let the code continue running and it will stop again when it hits your break point. From there you can step through code execution with “Step into” , “Step over” and “Step out” buttons. What I really love about this is you can view the local objects and values in the right hand pane and quickly figure out what is happening under the hood in your routine.
Our use of Qt's debugger engine is another example of how open source is putting high powered and high quality tools in the hands of the community without high costs.
You can learn more about the debugger online in the Qt Script Debugger Manual.
You can learn more about xTulple scripting and extension tools in the xTuple Developer Zone.

John Rogelstad
Forward-thinking strategist and visionary technology executive, with hands-on manufacturing and SDLC coding experience, conceptualizes world-class products and leads struggling companies to profitability and status as industry leaders. Consensus-building planning and development engineer exceeds customer expectations while continually analyzing growth opportunities. Empowering and approachable diplomat fosters strong relationships with clients, vendors and cross-functional teams while monetizing new services and optimizing operations to control costs. With a history of industry leading success and resourceful problem solving abilities, trusted mentor and natural leader coaches robust teams, ensures technical excellence across the enterprise. Business Analysis ▪ Budget Management ▪ ERP Engineering and Architecture ▪ Contract Negotiation ▪ Production Planning ▪ Process Improvement ▪ Strategic Partnership Development ▪ Project Management
Supply Chain Management ▪ Database Application Development ▪ Team Development ▪ UI Design
Object/Relational Mapping ▪ Root Cause Analysis ▪ Web Application Coding ▪ Agile Product Development